A visualiser for NASA's Socioeconomic Data and Applications Center.
Sedac-Vis is a comprehensive tool for visualising datasets curated by NASA's Socioeconomic Data and Applications Center (SEDAC), offering insights into the interplay between socio-economic factors and environmental conditions. Focused on current and projected performance based on IPCC scenarios, the visualization aims to provide a nuanced understanding of the relationship between sustainability considerations and wealth across diverse nations.
Key inquiries prompted by this visualization include the correlation between wealth and environmental concerns, global distribution of emissions, the evolving landscape of environmental issues, and the potential impact of food shortages on affluent and high-emission countries. Additionally, the study explores the variation in food production based on the global emission trajectory.
Spanning the years from 1990 to 2100, the dataset encompasses all countries worldwide. The featured indicators comprise wealth per capita, greenhouse gas emissions, environmental performance indices, and crop production, collectively contributing to a comprehensive analysis of the intricate dynamics between socio-economic and environmental variables.
Drag your cursor to rotate the globe and select the country, or simply enter its name in the searchbox.
Configure the dataset instance to visualise using the two dropdown lists.
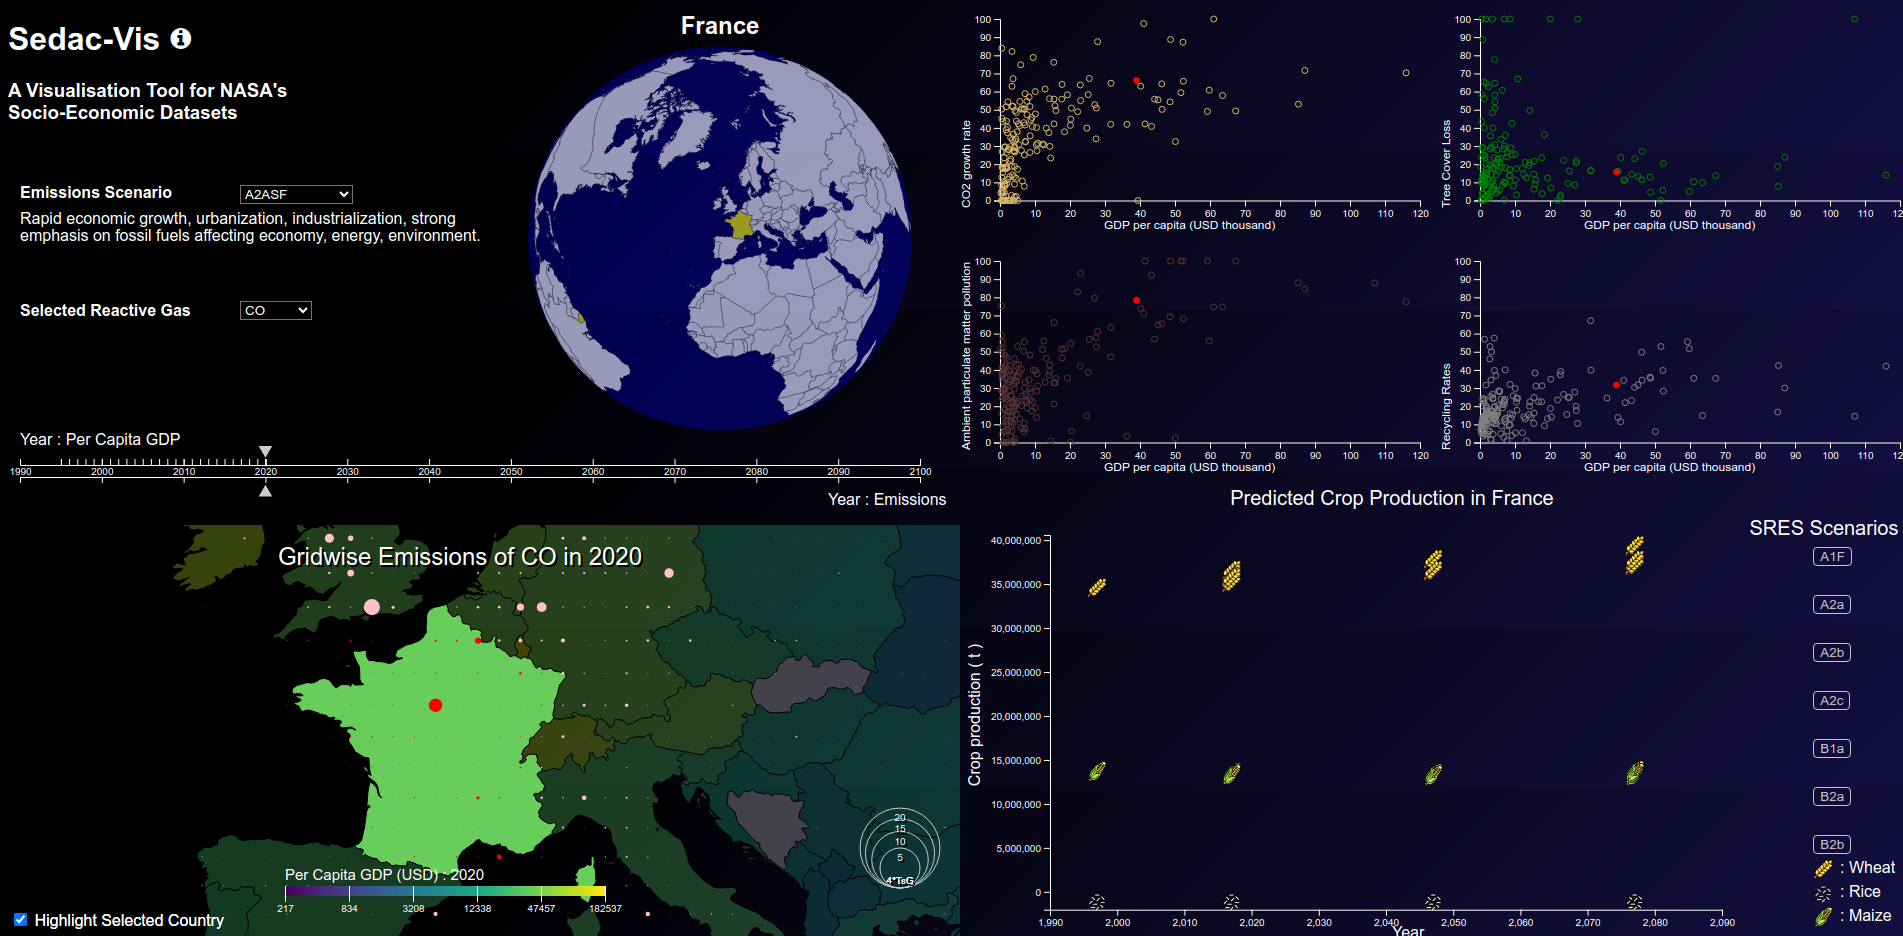
An illustration of the variation of Environmental performance indices vs GDP per capita over time. [France]
Move the sliders along the timeline to update visualisations in real time.
Projected crop yields for maize, rice and wheat for the selected country for different SRES scenarios.